Nextiva understands that business needs vary from company to company. While Nextiva Voice Analytics offers a variety of configurable dashboards that display important call metrics and reports, it also offers businesses the ability to create custom dashboards that reflect only the subset of data that is most relevant to their objectives.
For example, the owner of a vending company operates in three locations and wants to easily view total, inbound, and outbound call information for each location at any given time.
Use Nextiva Voice Analytics to create custom dashboards that display reports, metrics, and even gamification leaderboards.
Visit nextiva.com, and click Client Login to log in.
If logging in from Nextiva Voice (purchased before Dec 2020), select Voice > Analytics.
If logging in from NextOS (purchased after Dec 2020), select Communication > Phone System > Voice Overview > Go to Analytics.
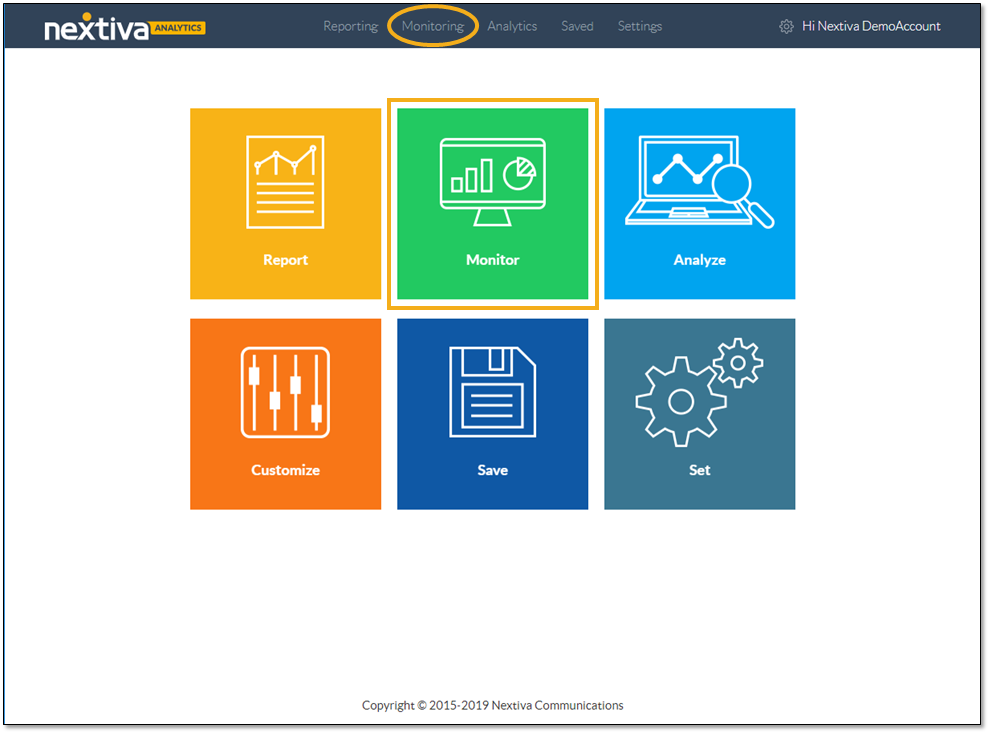
On the Nextiva Voice Analytics Home Page, click the Monitor tile or select Monitoring in the top menu bar.
On the Custom tab, customize the dashboard and click Save.
- Select the desired time range.
- Click the Round Arrow icon to turn real-time data ON (blue) or OFF (gray).
- Enter a name for the dashboard.
- Provide a brief description.
- Click the Add Item button to add elements to the dashboard.

Users can add three types of elements to the dashboard: Saved Report (custom reports), Call Type (metrics), or Gamification (leaderboards).
To Add Saved Reports:
- In the custom dashboard builder, click Add Item > Saved Reports.
- Configure the report element:
- First Tab: Enter a name for the dashboard element.
- Second Tab: Select the desired custom report.
- Third Tab: Select the chart type (Column, Bar, Table, or Pie).
- Fourth Tab: Choose whether to show or hide the chart legend.
- Click Update to add the report to the dashboard.
To Add Call Types:
- In the custom dashboard builder, click Add Item > Call Type.
- Configure the call type element:
- First Tab: Enter a name for the dashboard element.
- Second Tab: Select the desired metric.
- Third Tab: Filter the metric.
- Fourth Tab: Select the desired call type.
- Fifth Tab: Define the buckets.
- Specify the ranges for each bucket.
- Select a color to represent each bucket. The metric tile on the dashboard will display the color corresponding to the defined range to give the viewer a visual cue.
- Click the Plus (+) or Minus (-) icons to add or remove buckets as needed.
- Click Update to add the call type metric to the dashboard.
To Add Gamification Leaderboard:
- In the custom dashboard builder, click Add Item > Gamification.
- Configure the gamification element:
- First Tab: Enter a name for the dashboard element.
- Second Tab: Select the desired metric.
- Third Tab: Filter the metric.
- Fourth Tab: Select the desired call type.
- Fifth Tab: Select the number of participants to display on the leaderboard.
- Sixth Tab: Choose the theme for the leaderboard.
- Click Update to add the leaderboard to the dashboard.
After adding the dashboard elements, users can further customize the dashboard by repositioning (click-and-drag the tile across the canvas) and resizing (click-and-drag the bottom-right corner of the tile) the elements.
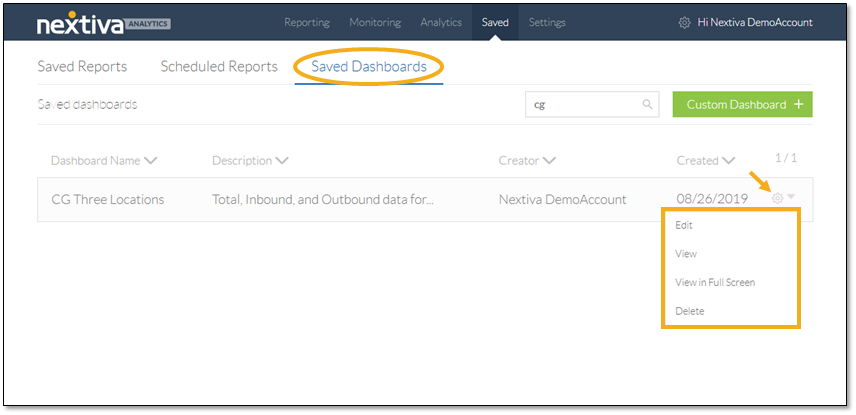
View custom dashboards by navigating to Saved > Saved Dashboards. Edit, view, or delete a dashboard by clicking the Gear icon corresponding to the desired dashboard. Users can also open a full-screen view of the dashboard.
With dashboards tailored to meet their specific needs, companies can easily keep their finger on the pulse of the business.