The User Dashboard allows supervisors to access various tables and graphs to monitor their agents. From one view, supervisors can instantly view real-time data, including all agent’s login times, statuses, and so much more.
Search for the Dashboards icon in the Options Menu. You can choose to open dashboards in the current window or in a new window, including the option to open all dashboards or just the User Dashboard.
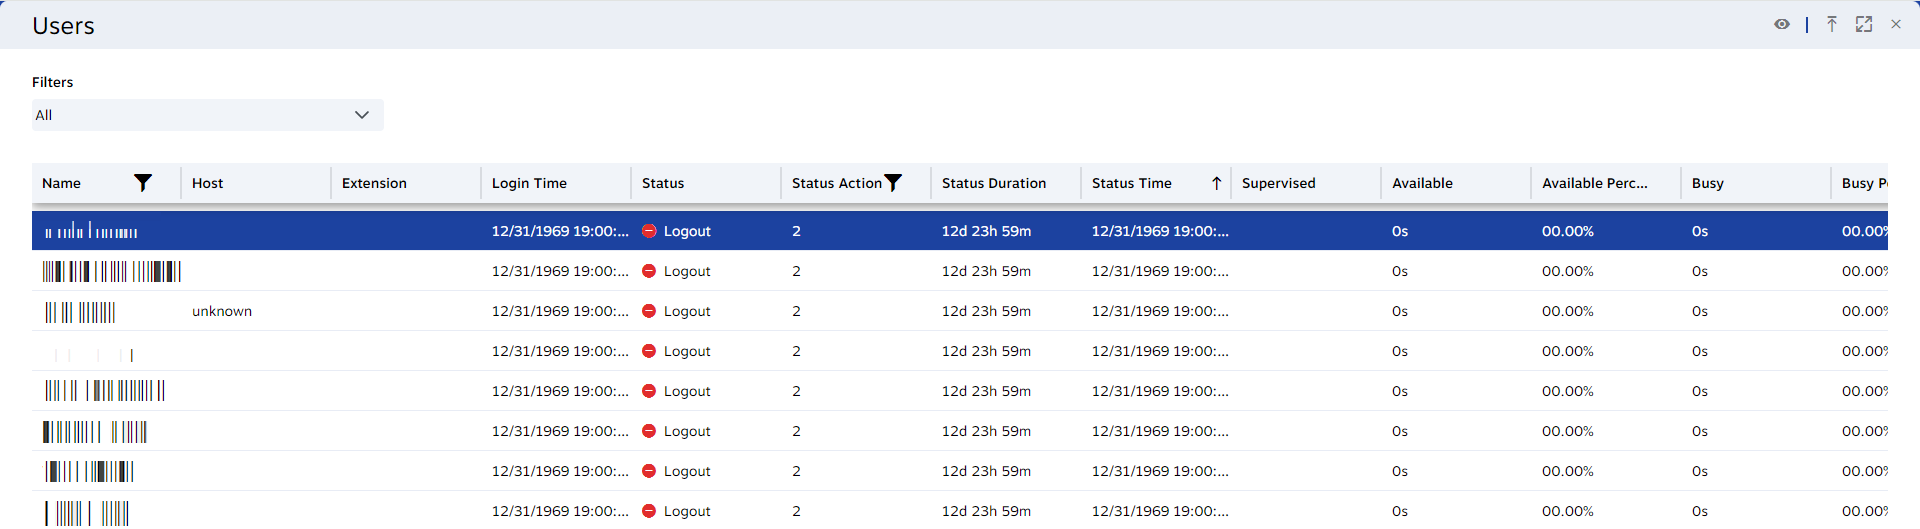
Column Headers
Supervisors can modify column headers to show the most relevant information. Drag-and-drop column headers to move columns.
|
Header |
Description |
|
Name |
The name of the user. |
|
Workitem Type |
The type of workitem the user handled. |
|
List |
The list the user’s workitem was associated with. |
|
Lead |
The ID of the lead. |
|
Extension |
The internal extension number assigned to the user. |
|
Skill |
The skills related to the user. |
|
Queue |
The queues the agent is assigned to. |
|
Login Time |
The date and time that the user logged in. |
|
Status |
The current status of the user (Available, busy, lunch break, etc.). |
|
Status Action |
A number associated with the status name. |
|
Status Duration |
The amount of times the user has been on the current status. |
|
Status Time |
The date and time that the current status started. |
|
Supervised |
An icon will display if the user is being monitored. (A supervisor is currently listening, coaching, or has joined a workitem.) |
|
Available |
The cumulative time the user’s status has been Available for the current day. |
|
Available Percentage |
The percentage of the user’s day on Available status (Available Duration/Login Time). |
|
Busy |
The cumulative time the user’s status has been Busy for the current day. |
|
Busy Percentage |
The percentage of the user’s day on a Busy status (Busy Duration/Login Time). |
|
No Answer |
The cumulative time the user’s status has been No Answer for the current day. |
|
No Answer Percentage |
The percentage of the user’s day on No Answer status (No Answer Duration/Login Time). |
|
Wrap Up |
The total time the agent spent in wrap-up time. |
|
Total Wrap Up Time |
The amount of time the agent’s workitems spent in wrap-up. |
|
Wrap up Percentage |
The percentage of the user’s day on Wrap Up status (Wrap Up Duration/Login Time). |
|
Working |
The cumulative time the user’s status has been Working for the current day. |
|
Working Status Percentage |
The percentage of the user’s day on Working status (Working Duration/Login Time). |
|
Failed Scorecards |
The number of scorecards that failed. |
|
Passed Scorecards |
The number of scorecards that passed. |
|
Transcription Usage |
The number of transcription minutes used out of the total amount of transcription time available (Transcription Minutes/Transcription Time Available). |
|
Campaign |
Displays the current Predictive/Progressive/QB campaign the user is logged into. |
|
Group Name |
Displays the name of the group the user is currently part of when using Predictive/Progressive/QB. |
|
Group Identifier |
Displays the ID number of the group the user is part of when using Predictive/Progressive/QB. |
|
High RTT (Round Trip Time) |
The time it takes (in milliseconds) for a request to be sent to the Nextiva server and for the request to be noticed. There will be a red x if the RTT exceeds 1000 milliseconds. Otherwise, it will be a green check. |
|
Low MOS (Mean Option Score) |
A rating of an experience on a scale from 1 to 5. There will be a red x if the MOS is below 3.5. Otherwise, it will be a green check. |
|
High Jitter |
Jitter is audio delay or any breakup during a call. There will be a red x if the average jitter is more than 5. Otherwise, it will be a green check. |
|
High Packet Loss |
Packet loss occurs when bits of information are not carried over a network. There will be a red x if the packet loss is more than 5%. Otherwise, it will be a green check. |
|
Voice Issues |
The number of voice issues (jitter, packet loss, etc.) that have occurred on the current day for that user. |
|
Active |
Depending on the filter chosen (voice, SMS, email, etc.), the number of workitems that the agent currently has. |
|
Answered |
Depending on the filter chosen (voice, SMS, email, etc.), the total number of workitems answered by an agent for the current day. |
|
Total No answered |
Depending on the filter chosen (voice, SMS, email, etc.), the total number of workitems offered from the queue and not answered or rejected by an agent for the current day. |
|
Total Transferred |
Depending on the filter chosen (voice, SMS, email, etc.), the current day’s total number of transferred workitems by an agent. |
|
AHT |
Average Handle Time: The average amount of time agents were handling workitems for the current day. (Talk Time + Wrap-up Time of all Calls Taken/ Number of Calls Taken) |
|
MHT |
Maximum Handle Time: The longest time an agent handled a workitem for the current day. |
|
Compliance |
An alert to the supervisor that an agent is out of compliance. |
|
Avg Talk Time |
The average amount of time the user spent talking to a customer. |
|
Avg Wrapup Time |
The average amount of time the agent’s workitems spent in wrap-up. |
|
Avg Hold Time |
The average amount of time that the customer was on hold for calls that went on hold. |
|
Total Talk Time |
The total amount of time the user was talking with a customer. |
|
Total Hold Time |
The total amount of time that all workitems were on hold. |
Arranging Columns
Supervisors can modify column headers to show the most relevant information. Drag-and-drop column headers to move columns.
Right-click on any of the column headers in the dashboard, and select Remove column or Reset grid. Resetting the grid brings back the default configuration.
NOTE: To add back a column that has been previously removed, right-click on any column header and select Add Column.
FIlters
Filter by Name
To filter by name or Status Action, click the Filter icon next to the Name column header.
Check the user(s), then click outside the checklist. To remove the filter, uncheck the user or right-click on the column header and select Reset Filter Field.
Status Action
To filter by name or Status Action, click the Filter icon next to the Status Action column header.
- status -1 This will only display users whose status is Working.
- status 0 This will only display users whose status is currently Available.
- status 1 This will only display users whose status is Login.
- status 2 This will only display users whose status is Logged Out.
- status 3 This will only display users whose status is Busy.
You can also combine these expressions by using this symbol “||”, which stands for Or.
Example: If the following is entered in the filter, the dashboard would only display the users that were Available OR Busy: status == 0 || status == 3