Dashboards allow supervisors to access different tables and graphs to supervise users, queues, interactions, campaigns, etc. Dashboards are real-time reporting displays that allow you to view information on agents, workitems, queues, and campaigns.
Opening Dashboards

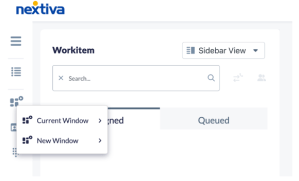
Click the Dashboard icon at the top left. You can open the dashboards in the Current Window or in a New Window. Then, you can choose to open all dashboards assigned to your user or a specific one.
If you choose to open in a new window, the dashboard(s) will open in new tabs in the browser. The names on the tabs will match the name of the dashboard(s) that have been opened.
Dashboard user interface
There are similar components when opening any dashboard. These components include:
- Filters
- Column headers
- Graphs
Filters
When you open a Dashboard, you will see a drop-down menu that allows you to filter by the different workitems. You can filter by:
- Voice
- SMS
- Chats
- Emails
- Inbound Calls
- Outbound Calls
- Predictive
- Progressive
- Inbound SMS
- Outbound SMS
- Offline
- Realtime
Column Headers
Each dashboard has different column headers. Supervisors can modify these headers, and the changes will be saved in their profile.
NOTE: Additional fields from the database can also be added to the dashboards in the Custom Fields field.
Removing Columns
Right-click on any of the dashboard column headers and choose Remove column or Reset Grid. Resetting the grid will restore the default configuration.
Adding Columns
To add back a column that was previously removed, right-click on any column header and choose Add Column.
Sorting Columns
You can move the columns to different positions in the dashboard by clicking on a column header and dragging it to the location you would prefer.
Graphs
A graphical display of information is presented in the bottom half of some of the dashboards.
If you do not wish to view the graphs, you can turn them off by selecting the Hide Graphics icon at the top right corner of the dashboard.
Using the drop-down arrow in the graphical area, there are options to show the graphs using different filters.
Exporting Dashboards to CSV
Each dashboard screen enables users to export the contents as a CSV file by clicking the export button located at the top right of each dashboard.