Agent Reports provide detailed insights into agent performance and activities. These reports track key metrics such as login times, call handling, media volume, occupancy, and more.
Click on any of the agent reports below to learn more.
Disposition
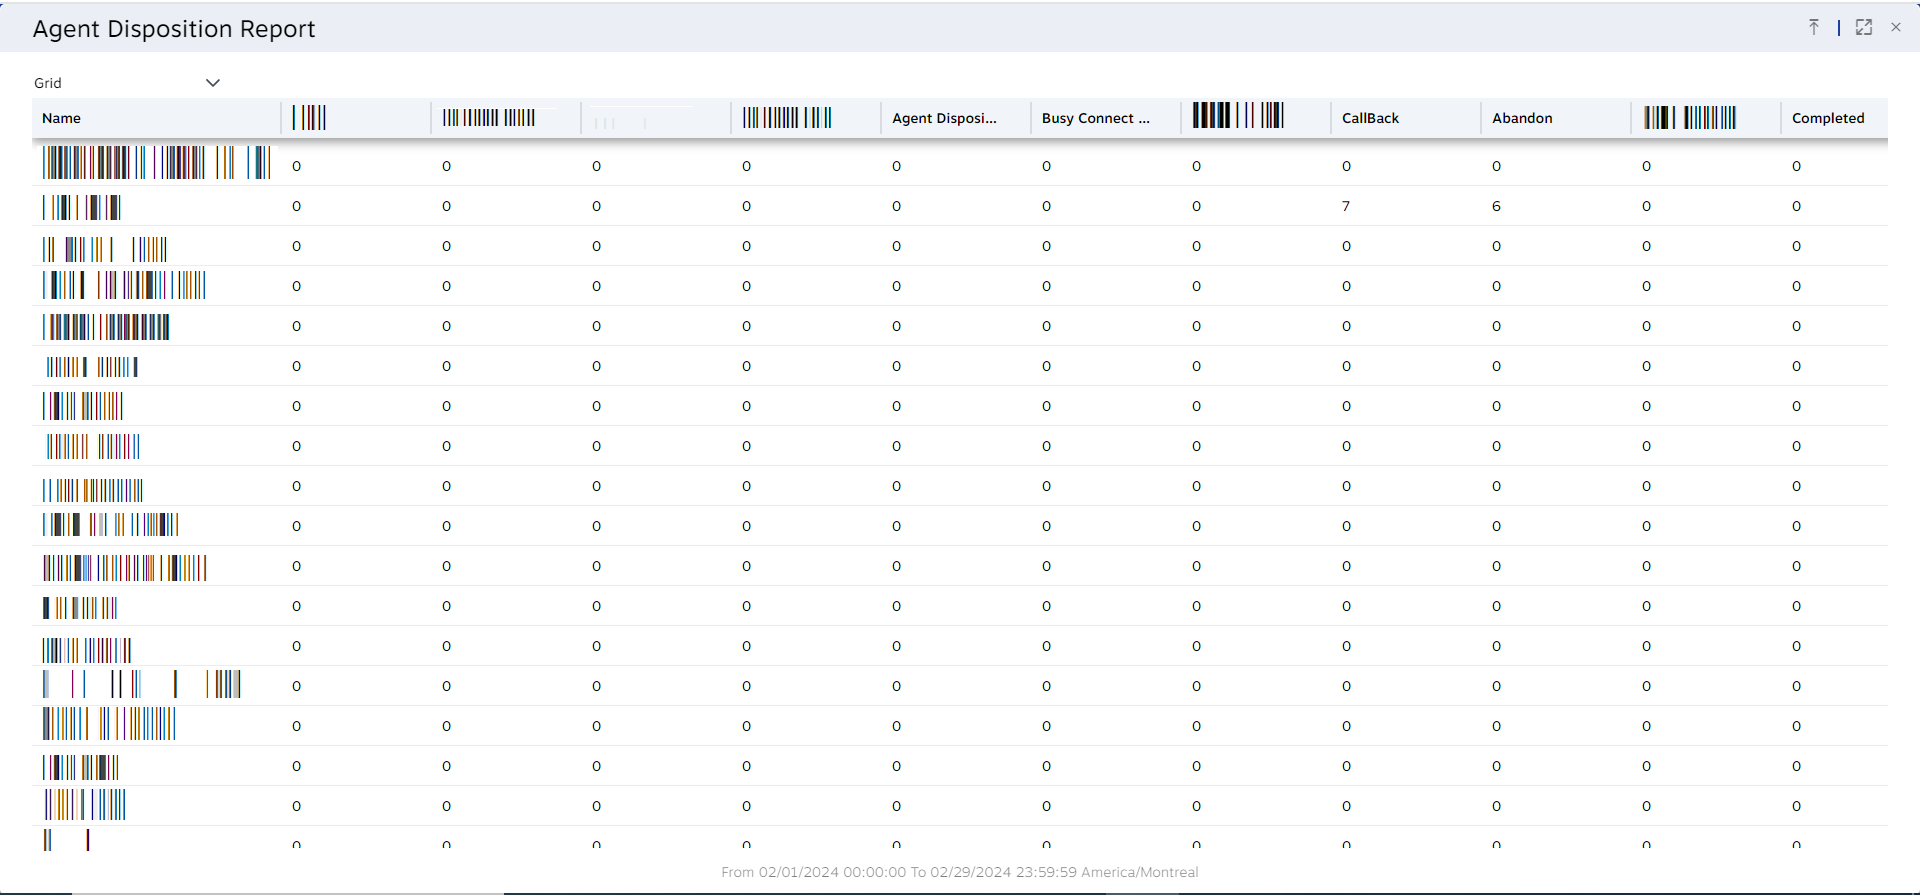
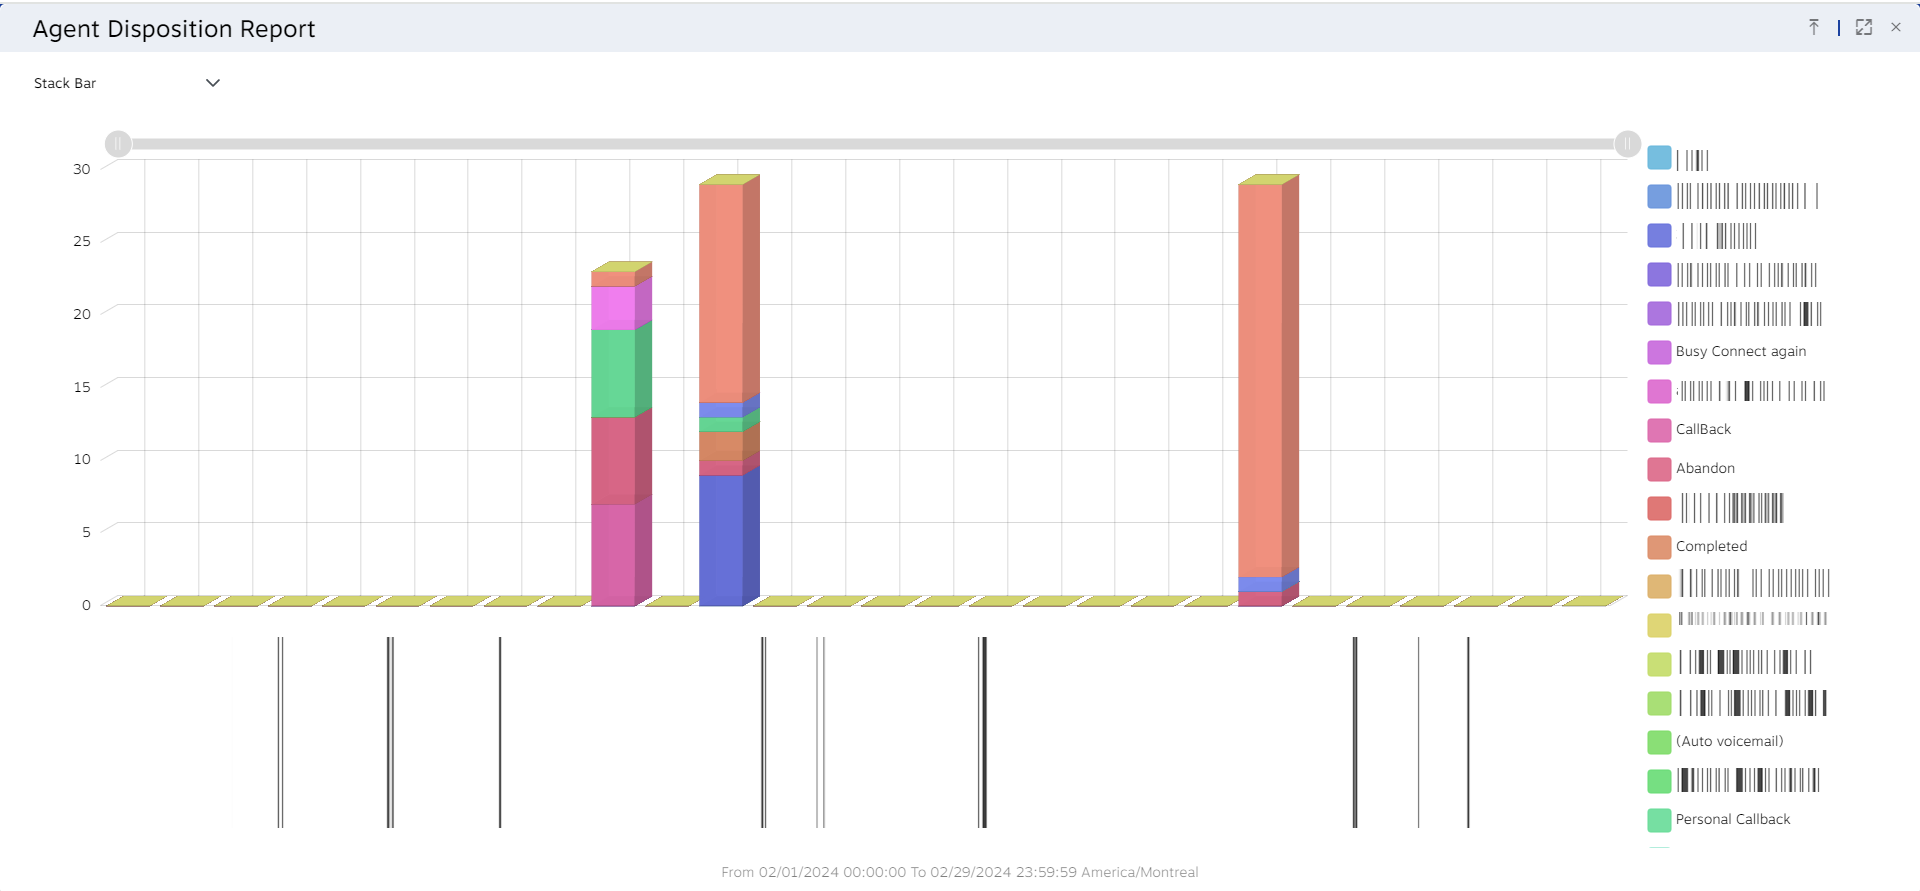
The Agent Disposition Report tracks the number of workitems, the average handle time, and the percentage of workitems by disposition.
For each work item handled, the report will display the following data:
|
Column Header |
Description |
|
Name |
The name of the user. |
|
Disposition X |
Total workitems with the disposition X. |
|
Total |
The total number of dispositions for that user. |
A separate column will be created for each disposition. The total number will be based on how many workitems are set to that disposition. Workitems with disabled dispositions will not be included in this report.
This is what the report looks like after being run in Grid View:
This is what the report looks like after being run in Stack Bar View:
Login
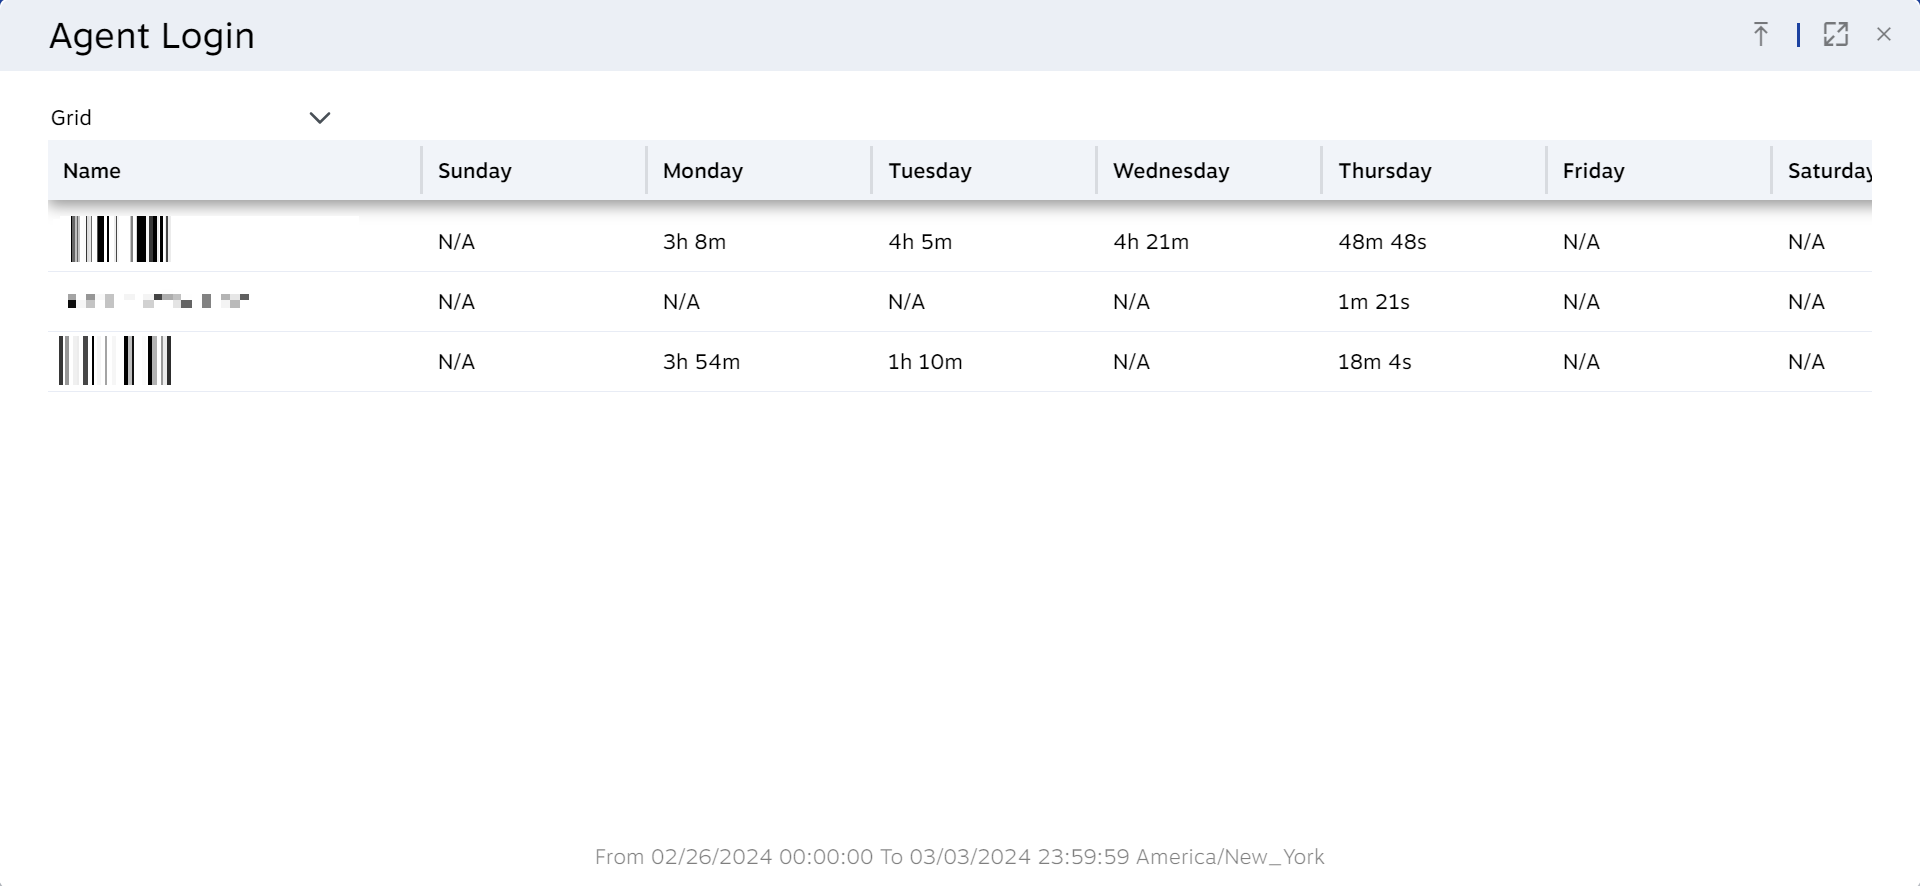
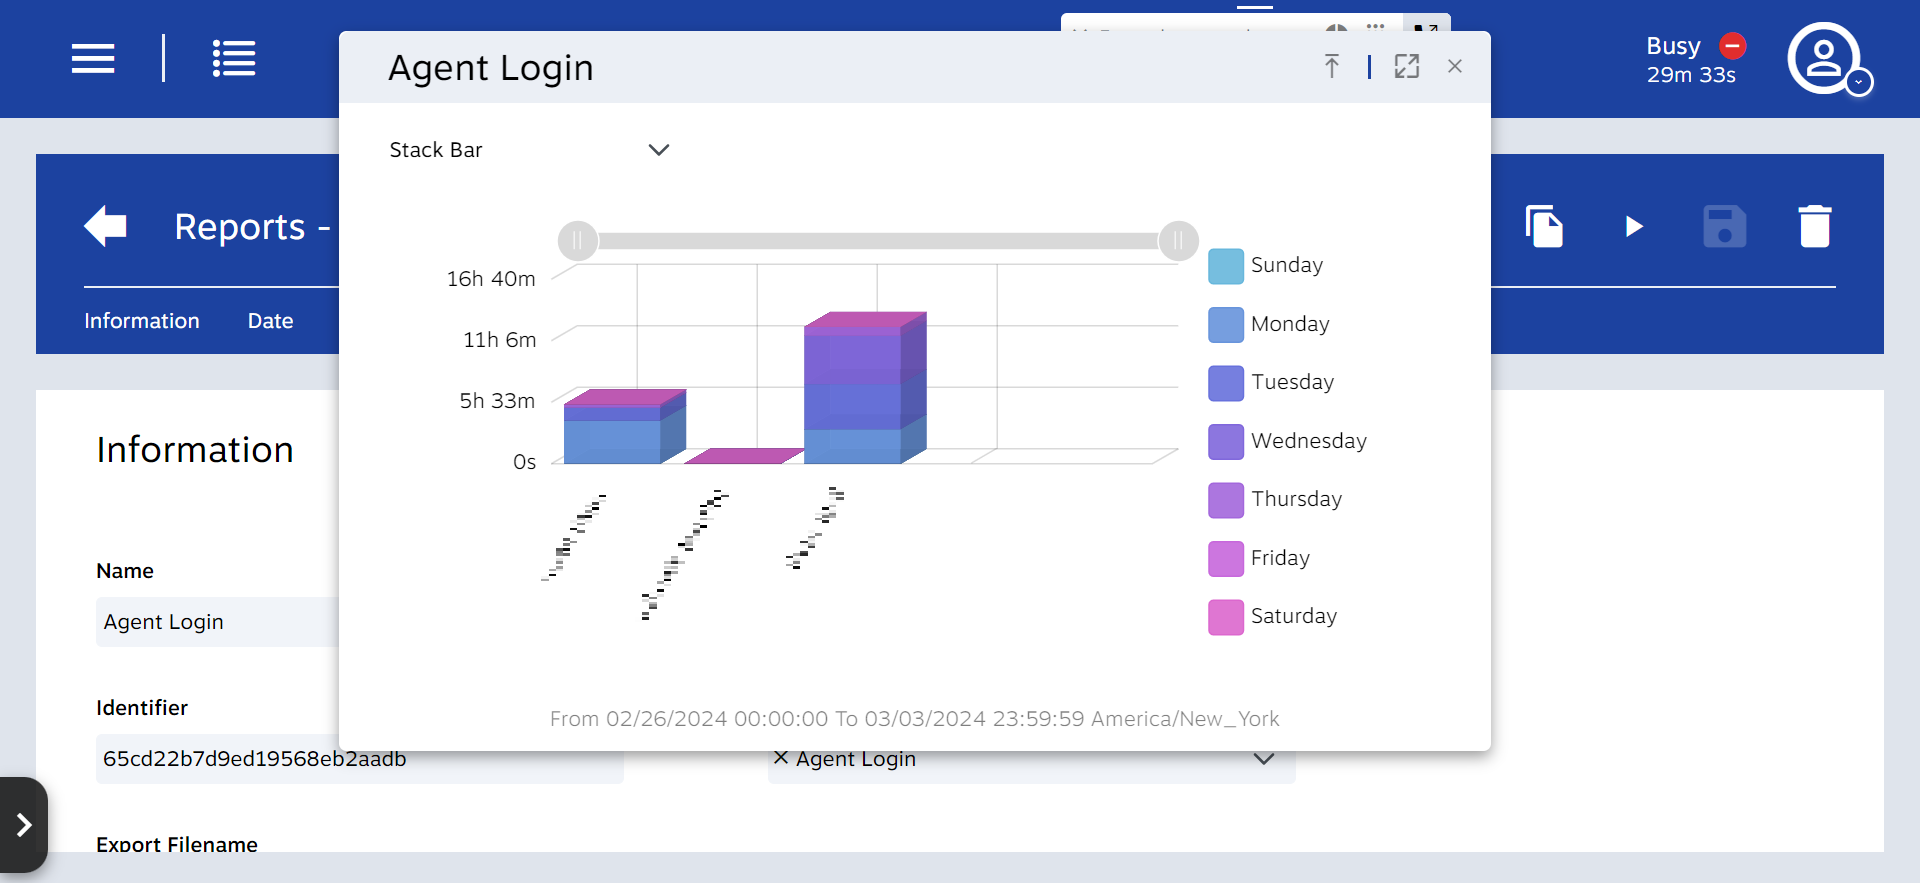
The Agent Login Report tracks the hours an agent is logged into the system. The is also an audit report that tracks the exact login and logout time of each agent.
For each report, the following information will be displayed:
|
Column Header |
Description |
|
Name |
The name of the user. |
|
Days / Weeks / Months |
The total amount of time logged in for the period. |
This is what the report looks like after being run in Grid View:
This is what the report looks like after being run in Stack Bar View:
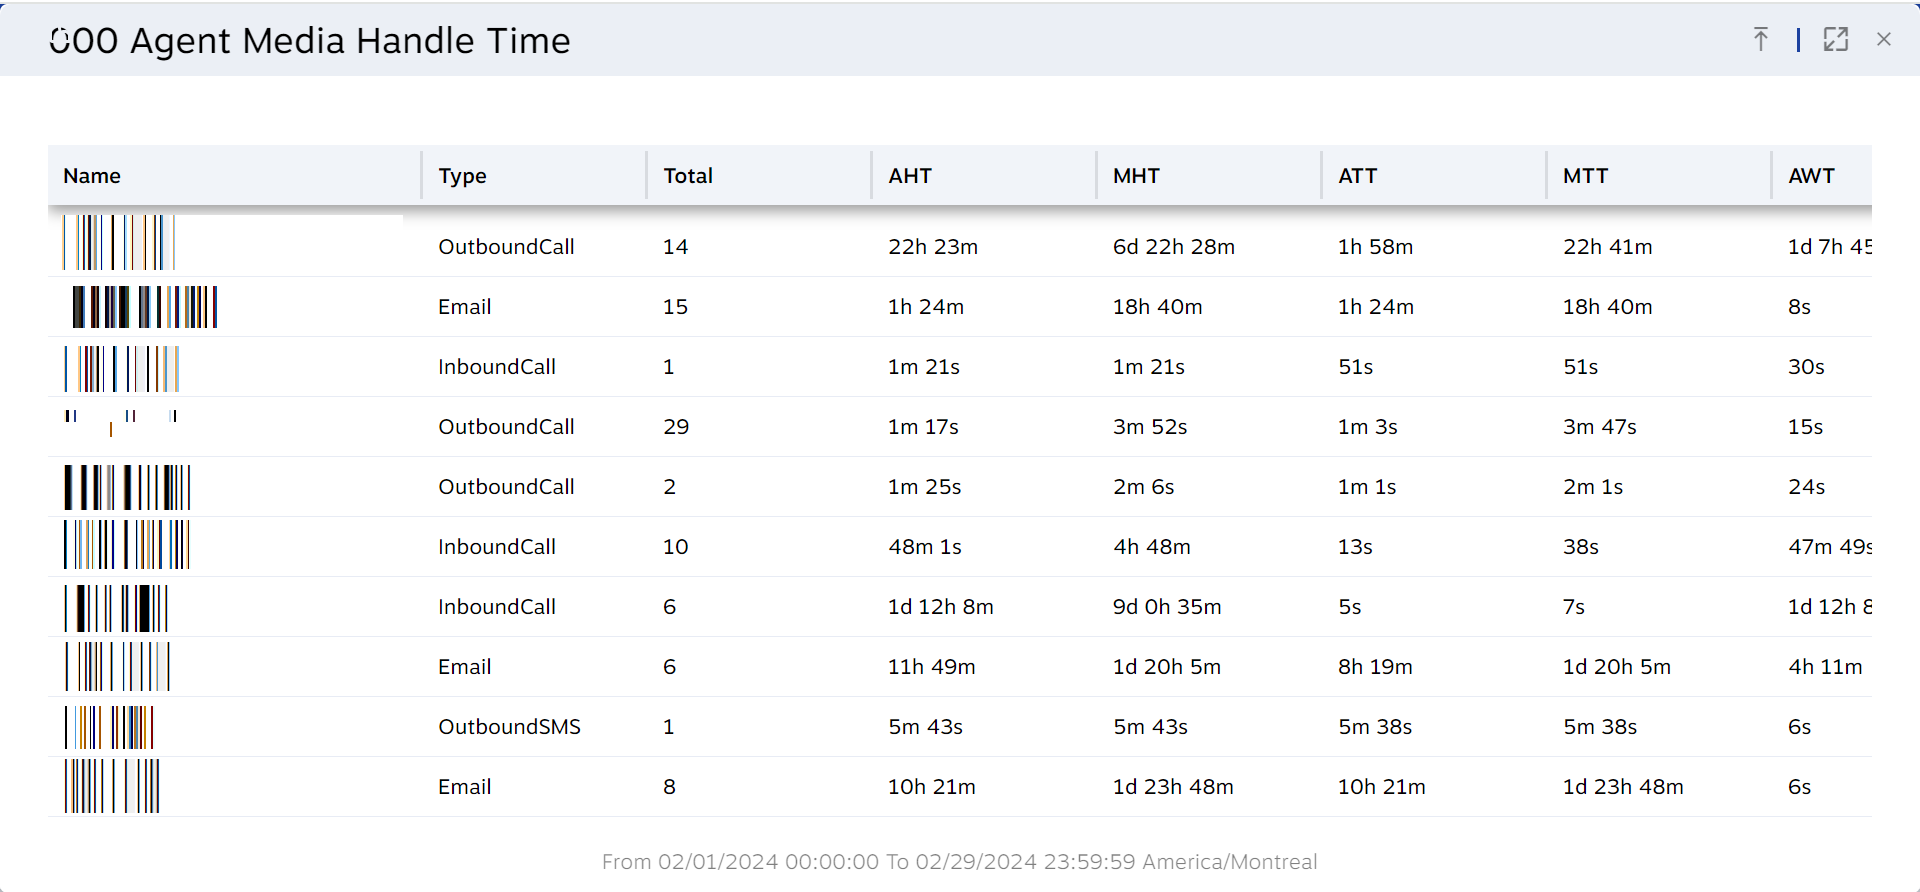
Media Handle Time
The Agent Media Handle Time Report tracks the talk time, wrap-up time, and handle time agents take to handle workitems.
|
Column Header |
Description |
|---|---|
|
Name |
The name of the selected user. |
|
AHT |
The average of the talk time + wrap-up time. |
|
MHT |
The largest talk time + Wrap-up time. |
|
ATT |
Average Talk Time |
|
MTT |
Maximum Talk Time |
|
AWT |
Average Wait Time. The average hold time of calls that the agent put on hold. |
|
MWT |
Maximum Wait Time. The maximum hold time of calls that the agent put on hold. |
This is what the report looks like after being run:
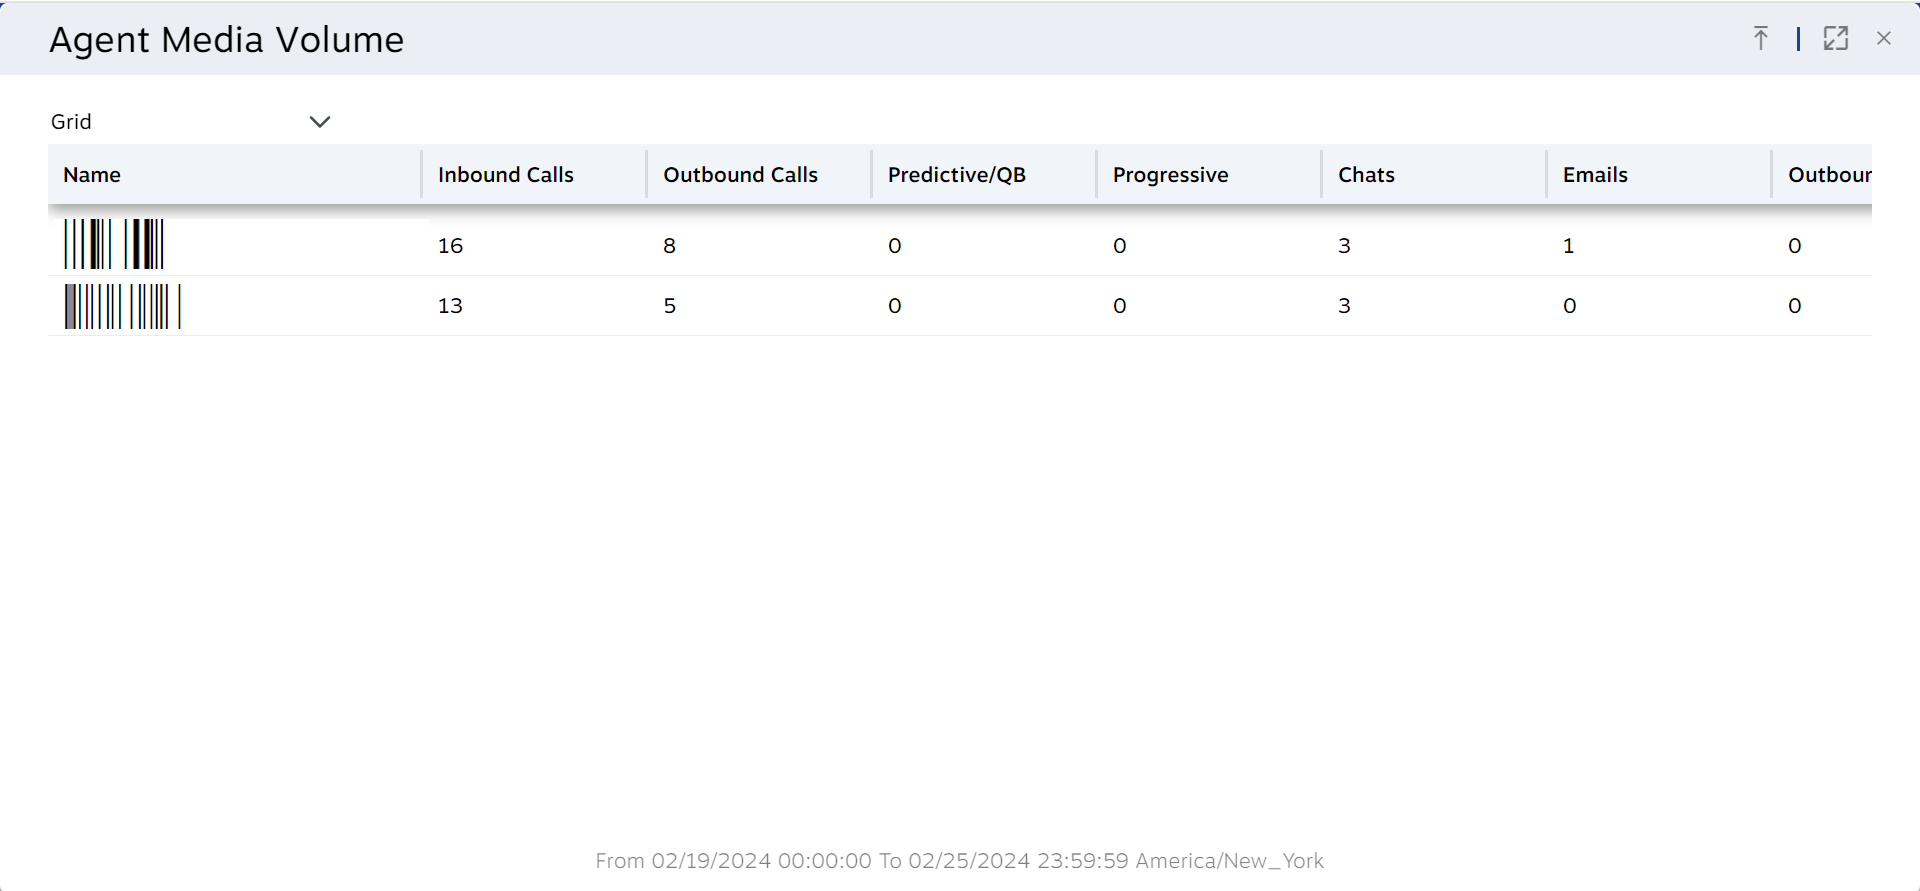
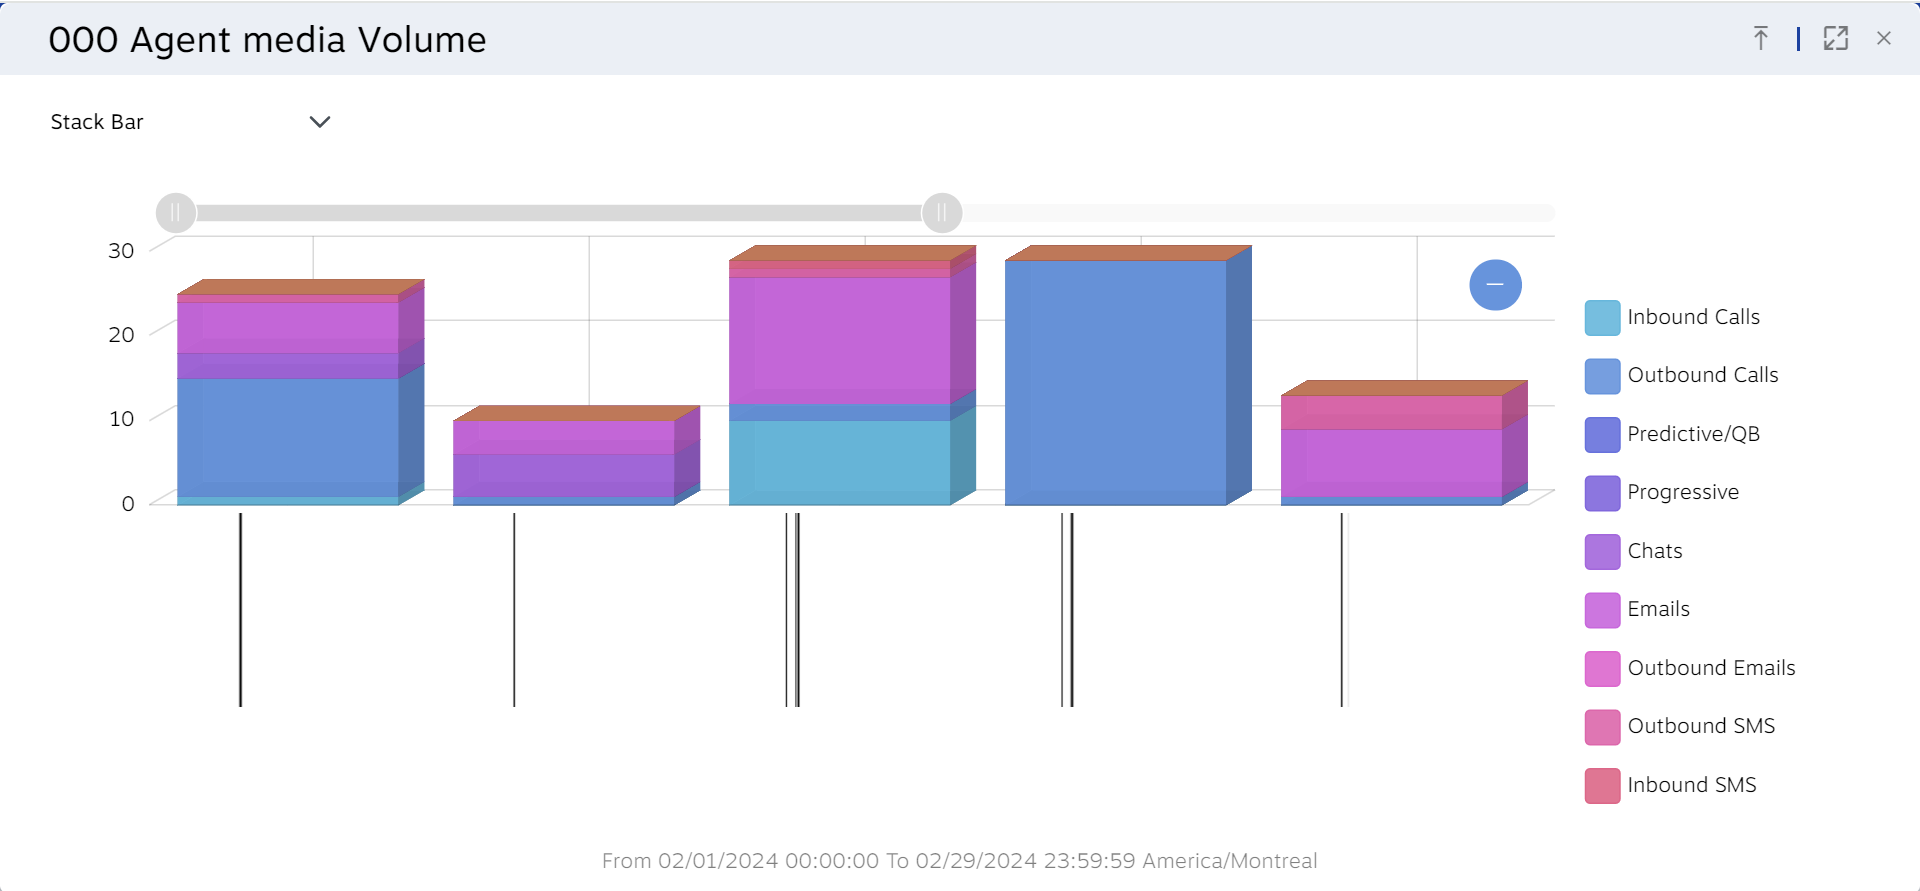
Media Volume
The Agent Media Volume Report displays the volume of the different media types in Nextiva handled by agents for a specified time. You can specify the agents and the time when you create the report.
This is what the report looks like after being run in Grid View:
This is what the report looks like after being run in the Stack Bar view:
The report in the grid view has the following column headers:
|
Column Header |
Description |
|
Name |
The name of the user. |
|
Inbound Calls |
The number of inbound calls the user handled. |
|
Outbound Calls |
The number of outbound calls the user handled. |
|
Predictive/QB |
The number of predictive/QB workitems the user handled. |
|
Progressive |
The number of progressive workitems the user handled. |
|
Chats |
The number of chats the user handled. |
|
Emails |
The number of inbound emails the user handled. |
|
Outbound Emails |
The number of outbound emails the user handled. |
|
Outbound SMS |
The number of outbound texts the user handled. |
|
Inbound SMS |
The number of Inbound texts the user handled. |
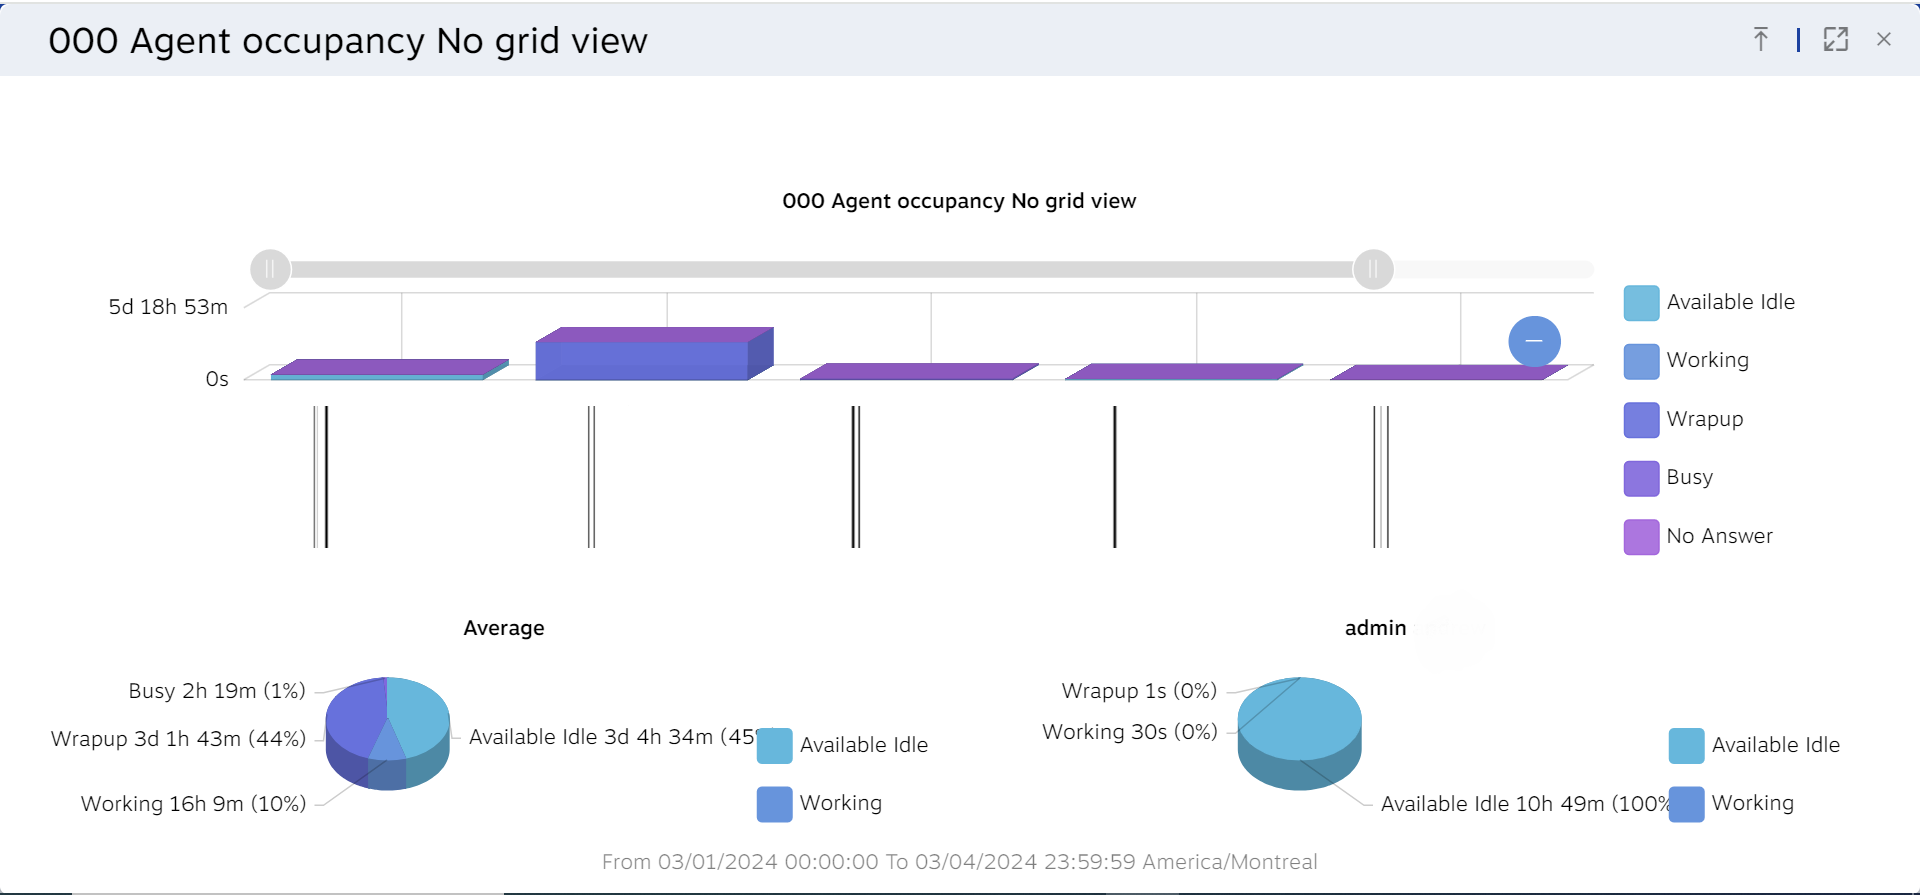
Occupancy
The Agent Occupancy Report breaks down how agents are spending their time. When creating the report, you can specify the list of agents and time range.
This is what the report looks like after being run; bar graphs and pie charts will display information.
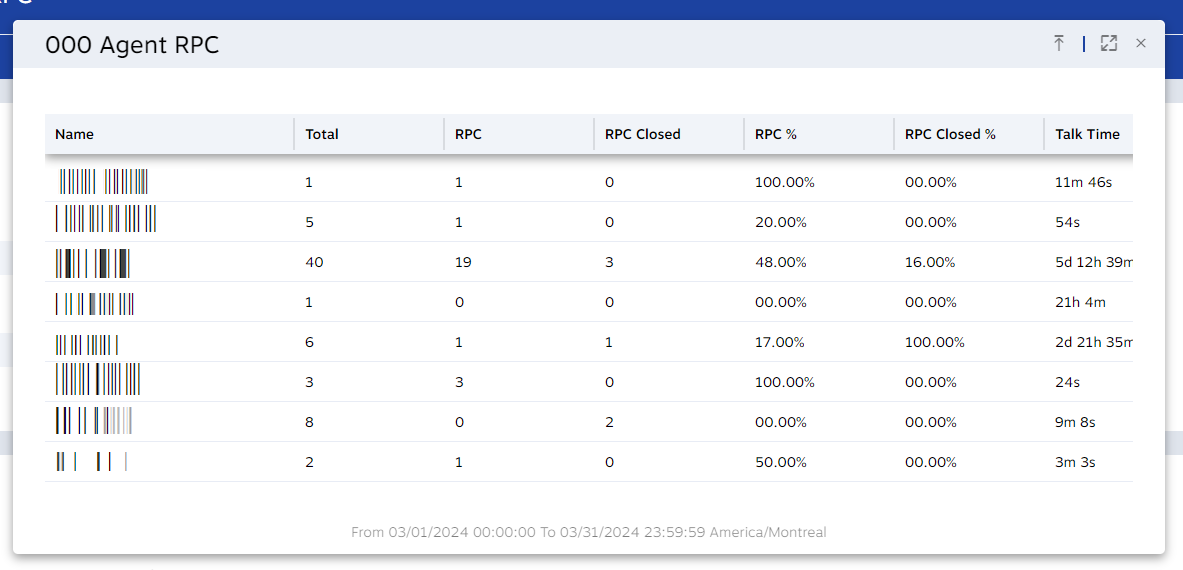
RPC
Right Party Contact refers to whether a user contacted the person they intended to. Every report has the following columns:
|
Column Header |
Description |
|
Name |
Name of the user. |
|
Total |
The number of calls the user received and dispositioned. |
|
RPC |
The number of correct parties contacted (based on disposition selection). |
|
RPC Closed |
The number of closed RPC calls (based on disposition selection). |
|
RPC% |
Calculated by (RPC / total) x 100. |
|
RPC Closed% |
Calculated by (RPC closed / RPC) x 100. |
|
Talk Time |
Total talk time for all the calls. |
|
ATT (Average Talk Time) |
Calculated by total talk time – talk time (in seconds) / total calls. |
|
Wrap-up Time |
Total wrap-up time for all the calls. |
|
AWT (Average Wrap-up Time) |
Calculated by total wrap-up time – wrap-up Time (in seconds) / total calls. |
|
Working Hours |
Total login time for all the calls. |
|
Avg Calls Per Hour |
Calculated by total calls / working hours. |
NOTE: RPC Closed means that the contact should not be contacted again.
This is what the report looks like after being run:
Scorecards
The Agent Scorecards Report summarizes all the time supervised agents used a scorecard and the campaign results. You can select the agents and the scorecard results when creating the report.
For each work item handled, the report will display the following column of data:
|
Column Header |
Description |
|
Name |
Name of the scorecard. |
|
Campaign |
Name of the campaign. |
|
Created At |
The date the call happened. |
|
Call Id |
The ID number of the call. |
|
From |
The number where the call originated from. |
|
To |
The number that received the call. |
|
Type |
The type of call. |
|
Agent |
Name of the agent. |
|
Result |
Result of the call. |
NOTE: This report displays scorecards associated with specific users.
This is what the report looks like after being run:

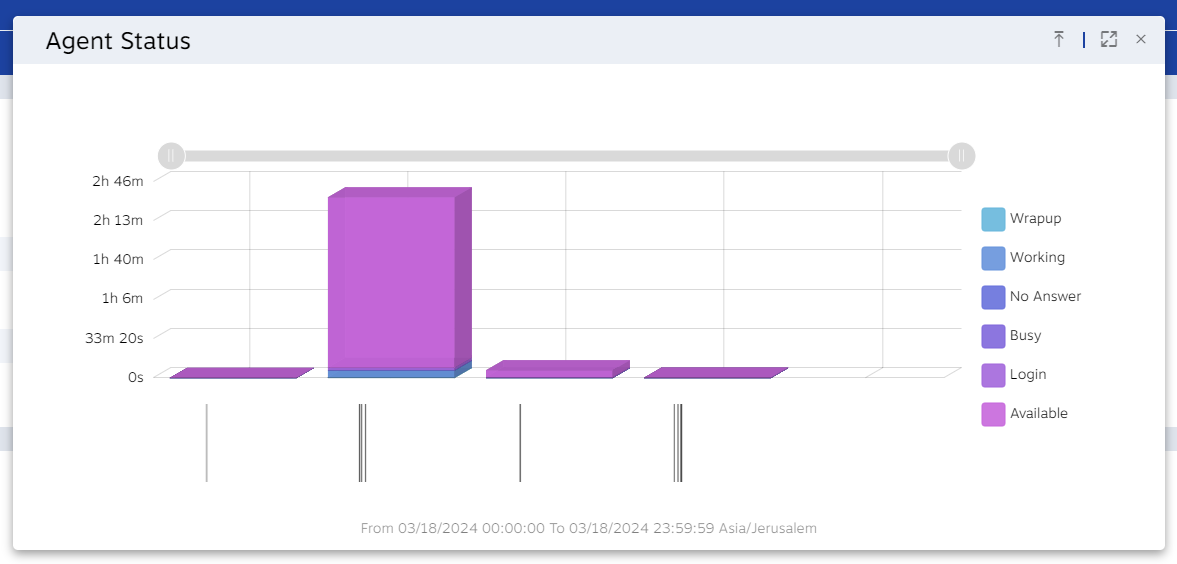
Status
The Agent Status shows how long supervised agents spent on a specific status for a specified period. You can select the time range when creating the report.
Every report has the following columns:
|
Column Header |
Description |
|
Name |
The name of the user. |
|
Status X |
The amount of time spent on status X. |
This is what the report looks like after being run:
KPI
The Agent summary KPI report tracks the talk time, wrap-up time, and handle time agents take to handle workitems.
Every report has the following columns:
|
Column Header |
Description |
|
Name |
The name of the user. |
|
AHT |
Average Handle Time. |
|
MHT |
Max Handle Time. |
|
THT |
Total Handle Time. |
|
ATT |
Average Talk Time. |
|
MTT |
Max Talk Time. |
|
TTT |
Total Talk Time. |
|
AWT |
Average Wrap-up Time. |
|
MWT |
Max Wrap-up Time. |
|
TWT |
Total Wrap-up Time. |
Workitem
The Agent Workitem Detail Report is a detailed list of every workitem placed or received by a user. For each workitem handled, the report will display the following data:
|
Column Header |
Description |
|
Name |
The campaign name the workitem is associated with. |
|
CallID |
The call ID. |
|
Agent |
The name of the user. |
|
Created At |
The time the workitem started. |
|
From |
The From address. |
|
To |
The To address. |
|
Type |
The type of workitem. (Inbound/Outbound/Email/SMS…) |
|
Disposition |
The final disposition of the workitem. |
|
In Review Time |
The time the user takes to review any information before placing the workitem. (Progressive, ACD Callback, ACD Voicemail). |
|
Ring Time |
How long the phone rang before being answered on Manual Outbound and Progressive calls. |
|
IVR (Interactive Voice Response) Time |
The amount of time the caller spent in the IVR. |
|
Total Queue Time |
The total amount of time the workitem spent in the queue. |
|
Talk Time |
The total amount of time the customer was connected with the user. |
|
Hold Time |
The total amount of time the workitem was on hold. |
|
Abandon Time |
The time the customer stayed in the queue before disconnecting without speaking to a user. |
|
Transferred |
Has a value of 1 if the workitem was transferred and 0 if the workitem wasn’t transferred. |
|
Duration |
The total duration of the workitem. |
|
Wrap up Time |
The total time it took to wrap up the workitem. |
|
Handle Time |
The time from when the user accepts the workitem to when the workitem has been dispositioned. |