 Customer Experience
  Blog
Blog  Business Communication
  Leadership
  Marketing & Sales
  Productivity
  VoIP
VoIP 


When we asked 1,058 people what influences customer experience most for our annual Nextiva CX Trends Report, 60% of them said customer service. While marketing, sales, and onboarding influence the overall experience, nothing leaves as big an impact on customers as the support experience.
Customers usually contact support when something’s wrong — they’re frustrated, confused, or stuck. How you handle those vulnerable moments either strengthens their loyalty or drives them away. One great interaction can turn a complaint into advocacy, while one poor experience can end the relationship entirely.
That’s exactly where customer service metrics become a must-have. They tell you whether you deliver during those frustrating moments or fall short.
Where Do You Rank on the AI Maturity Curve?
Take the 5-minute assessment and get a personalized score and recommended next steps.
These 18 customer service metrics will show you where your CX is breaking down and what’s driving customer satisfaction (or killing it).
What Are Customer Service Metrics?
Customer service metrics are key performance indicators (KPIs) that measure the efficiency and quality of your CX operations. They tell you what’s working, what’s not, and where you need to focus your attention. You can use these metrics to track everything from how fast agents respond to tickets to how satisfied customers are with service quality.
Customer service metrics can usually be divided into two categories:
- Quantitative metrics are numerical data points that measure the efficiency of your customer service ops. These include metrics like average response time and first-contact resolution rate.
- Qualitative metrics focus on customer sentiment and the subjective quality of interactions. Metrics include Customer Satisfaction (CSAT) scores and Net Promoter Score (NPS).
Combined, these metrics help measure customer service from both the agent and customer perspectives. In fact, one of the fastest quick-win opportunities is when one metric is high and the other is low. Balancing them can give your support team immediate gains.For example, high resolution times with low CSAT scores might mean agents close tickets fast, but the answers aren’t particularly helpful for customers. On the other hand, an agent with a higher average handle time might get better CSAT scores because they take the time to provide thorough, thoughtful answers.
Why Are Customer Service Metrics Important?
Customer service interactions define how customers experience your brand. While high-quality support can strengthen long-term relationships, poor interactions can result in disgruntled customers and eroded brand trust.
Here’s how measuring customer service metrics can help you ensure actually helpful customer interactions:
- Confirm customers are getting real help: Customer service metrics can show whether your team is actually resolving problems or just providing temporary fixes that create more frustration.
- Catch service quality issues: Detect declining performance trends and act on warning signals before they harm customer relationships or your brand reputation.
- Ensure consistently good support: Routinely monitor and measure customer service performance to ensure all customers get the same level of support, no matter which agent they contact.
- Identify training opportunities: Spot patterns that indicate agents might need some coaching or product training to serve customers better.
- Create a feedback loop: Use insights from customer service metrics to improve service quality so it’s aligned with customer expectations.
A 2024 McKinsey study of 25,000 customers found that satisfied and delighted customers are more profitable. This includes 30% more cross-sell in banking, 19% higher repeat rates in tourism, and up to a 12% revenue boost in insurance.
Customer Experience & Satisfaction Metrics
Let’s take a look at the top customer service metrics for the overall customer experience.
1. Customer Satisfaction Score (CSAT)
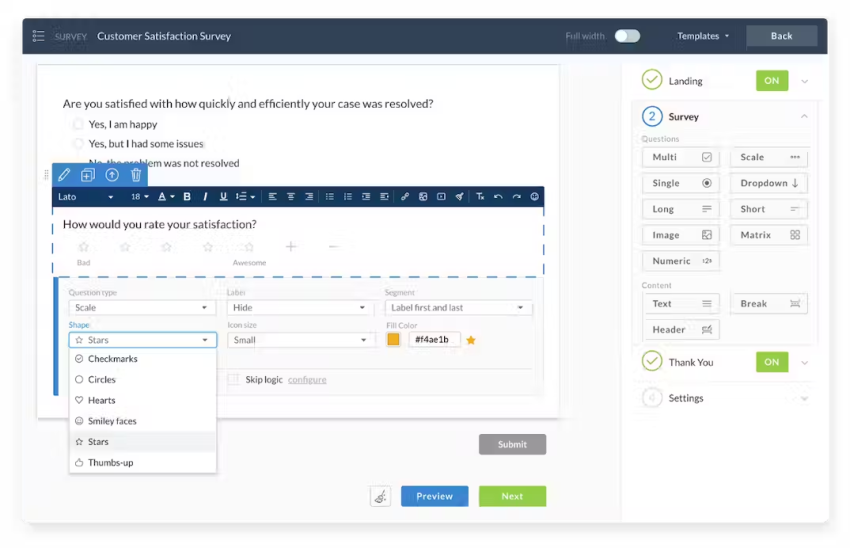
Happy customers spend more and churn less. One of the best ways to measure customer satisfaction metrics is through CSAT surveys. This is one of the most important “voice of customer” metrics that measures what customers feel, think, and do regarding your business.
Calculate your CSAT score by giving a simple, one-question survey after a customer interaction: “How would you rate the customer service experience?”
You can vary the customer satisfaction survey question if the intent stays the same. Then, customers can respond on a scale from 1–5, with 1 being Very Unsatisfied, 3 being Neutral, and 5 being Very Satisfied.
A good customer satisfaction score is a 4 or 5.
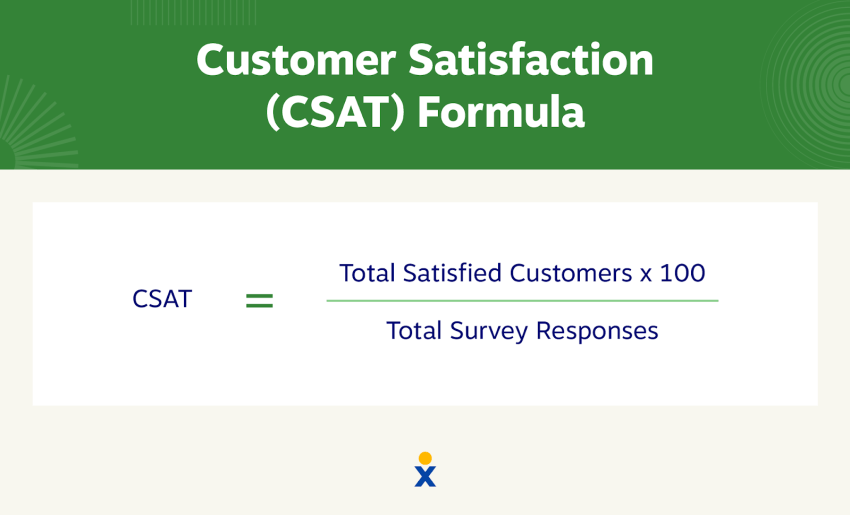
If you surveyed 100 customers, and 43 answered “Satisfied” while 29 answered “Very Satisfied,” your CSAT score would be 72, based on the formula. The American Customer Satisfaction Index (ASCI) publishes the CSAT scores of several major companies every year. This public data makes it easy to benchmark your customer satisfaction survey metrics against other companies in your industry.
Invest in regular agent training to reduce mistakes and increase agent confidence.
Some tools, like Nextiva, come with supervisory monitoring and coaching features where managers can support agents in real time:
- Agents can “raise their hand” when they need help, so managers can coach them in real time.
- Supervisors can set their own rules for when to intervene, like if a call exceeds a certain time limit.
- Managers can monitor multiple interactions at once and switch between them, so they can help multiple customer support agents at the same time.
2. Net Promoter Score® (NPS)
The Net Promoter Score is another survey-based, voice-of-customer metric that shows how likely a customer is to recommend your business to others. Net Promoter Score is a staple for SaaS businesses and apps, and businesses often use it when forecasting organic growth.
Unlike with the CSAT survey, you don’t have to run an NPS survey after a support interaction. Instead, send the NPS survey to a customer after they purchase a product or service.
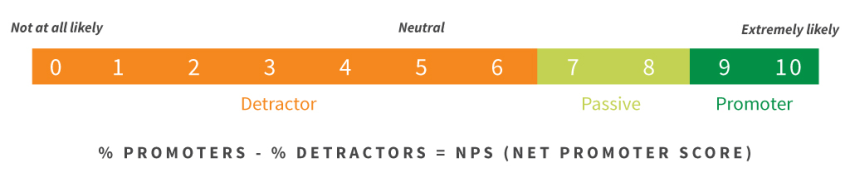
Like the CSAT, NPS surveys are also just one question: “How likely is it that you would recommend [BRAND] to a friend or colleague?”
Answers are usually on a scale from 1–10. To find the NPS, you divide the results into three categories:
- Detractors (Scores 0–6)
- Passive (Scores 7–8)
- Promoters (Scores 9–10)
If you surveyed 100 customers and 70 answered 9–10, 20 answered 7–8, and 10 answered 1–6, your NPS would be 60.
Quickly reducing first-impression metrics like hold time, response time, and resolution time can leave a good impression on customers and encourage them to recommend you.
3. Customer Effort Score (CES)
The Customer Effort Score is another single-question, survey-based metric. CES uses a 1–7 scale and asks the question: To what extent do you agree or disagree with the following statement: “The company made it easy for me to handle my issue.”
Then, the answer scale ranges from 1 (strongly disagree) to 7 (strongly agree). Total CES is the average of all the answers.
CES is particularly valuable because it focuses on ‘friction’ rather than ‘satisfaction’. A customer might be happy with the final answer, but still frustrated by the process that got them to the answer.
Most often, reducing customer effort is more impactful than exceeding expectations. A lot easier, too.
Reduce negative customer feedback and the number of customer issue tickets (like adding self-service resources) and lower average resolution time to encourage higher Customer Effort Score responses.
4. Social media and online review metrics
Social media mentions, review ratings — and online sentiment on the whole — show how customers talk about your brand and service in public. These metrics are especially important because they reveal how current customers perceive your brand and influence potential customers. Prospects often trust reviews more than your own marketing or communications.
There are two main ways to measure this. One is using social listening tools and checking review platforms directly. The other is using a consolidated platform, like Nextiva, that consolidates all reviews so you can manage your online reputation in one place.
Set up automated alerts for reviews or social mentions so you can respond quickly. Quick responses, especially to negative feedback, show prospects you take issues seriously, even if the original reviewer isn’t fully satisfied.
5. Next issue avoidance
Next issue avoidance measures agents’ steps to prevent potential problems for customers. This includes proactive actions like suggesting preventive solutions or providing resources to help customers with future needs.
This metric looks beyond resolving the ticket on hand. It shows whether agents are anticipating future needs, so customers don’t have to reach out again. For example, if a customer calls with a billing question, a proactive agent might explain upcoming plan changes. This approach lowers future contact volume and improves the overall customer experience.
For managers, this metric shows whether an agent is customer-centric and empathetic, and if they can be trusted to handle complex or high-value customer interactions.
Use predictive analytics to anticipate customer needs and encourage proactive communication, especially if it’s bad news.

Customer Retention & Loyalty Metrics
Here are some metrics for measuring customer service that encourage repeat customers and improve customer loyalty.
6. Customer churn rate
For any high-growth service business, customer churn is a key customer service metric. Churn is the percentage of customers who leave during a specified time frame.
For example, if you had 100 customers last year, and 12 months later you have 50 of those same customers, this means your customer churn rate is 50% (over 12 months). There is no unified time for churn, but companies calculate it by weeks, months, or quarters.
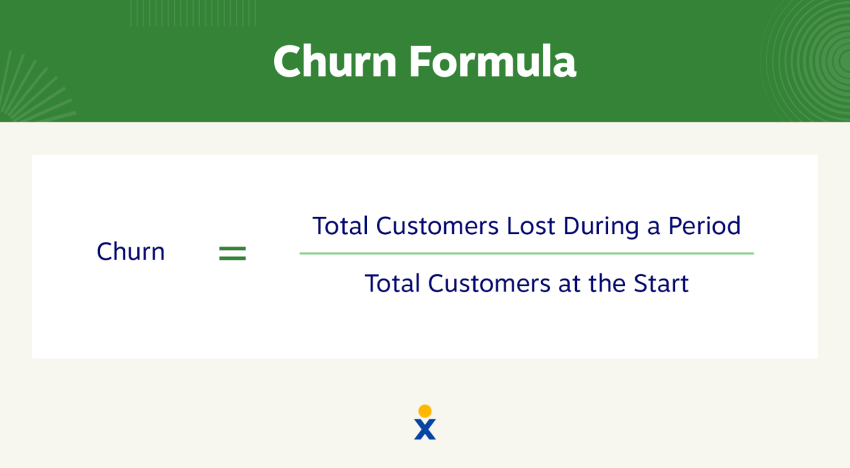
Churn rates over different periods can give you insights into how different variables affect customer retention. For example, if you introduced a new CRM tool in June, churn for the calendar year might look different in the year’s first half compared to the second half.
It all depends on the industry, type of service, and contracts. A social media app might go as far as to calculate churn by the day. A real estate management company might calculate it by the year. But regardless of the industry, reducing customer churn should always be top of mind.
Spotlight the customer journey touchpoints where most churn happens and redirect resources to improve that pain point.
7. Customer retention rate
Keeping existing customers is 5-25 times less costly than acquiring new ones. That makes customer retention an extremely important customer service metric to track for long-term business success.
Customer retention rate is calculated as the percentage of customers who stay with your company over a specific period. Like customer churn, retention can be measured over various timeframes, such as monthly, quarterly, or annually.
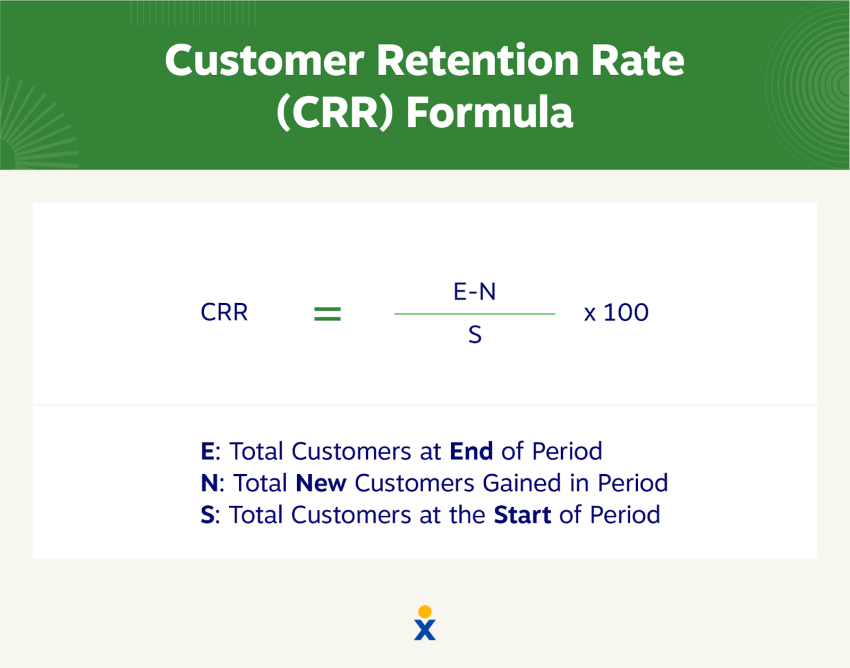
For example, say you had 100 customers at the beginning of a year and 80 of them were still customers at the end. Your retention rate would be 80%.
Shift from solving one-off problems to building lasting relationships that make customers feel like partners, not tickets. This builds customer loyalty, and that’s one of the best ways to retain customers, even if competitors come with more flashy deals.
8. Customer Lifetime Value (CLV)
Customer Lifetime Value (CLV) measures the total revenue a business can expect from a single customer over their relationship. Most customers don’t become profitable to your business until you retain them for a certain period of time.
So, this metric shows whether your retention rate is strong enough to make customers profitable over time.
The basic formula to measure CLV is:
(Average Purchase Value * Purchase Frequency * Customer Lifespan) – Customer Acquisition Cost
For example, if customers spend $100 monthly, stay for 24 months on average, and cost $50 to acquire, their CLV is ($100 * 24) – $50 = $2,350.
Analytics tools can help you go deeper by factoring in nuances like discount rates, referral payments, and more.
For customers nearing profitability, focus on cost-effective retention tactics like self-service resources and check-ins. For customers who are already profitable, invest in premium experiences like dedicated support and personalized upselling.
That way, you cover your bases.
Operational Efficiency Metrics
These metrics are for measuring customer service quality and efficiency, so you can run smooth operations.
9. First Response Time (FRT)
First response time, also known as first reply time, is the time it takes you to respond to a customer inquiry or ticket. This is different from Average Response Time (ART), which is the average time it takes for an agent to respond to messages within an ongoing conversation.
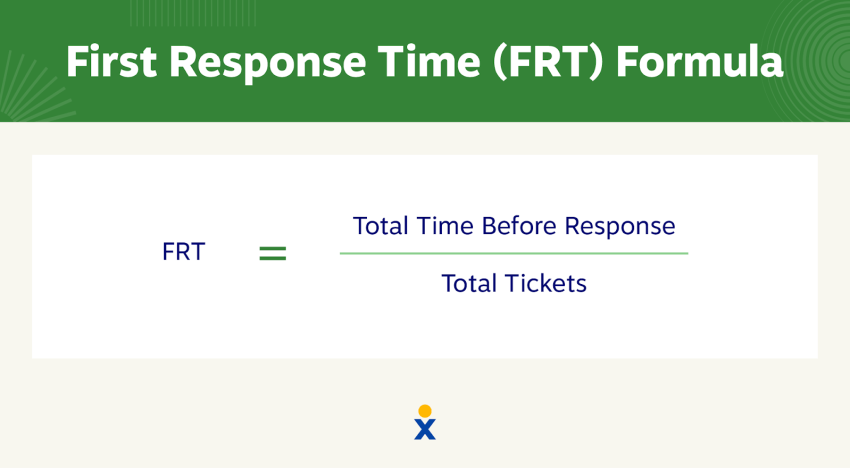
When you record response time, it’s vital to differentiate between communication channels. This accounts for the different customer expectations seen in each channel. Some customers might think that a 24 to 48-hour email response time is acceptable, while an Instagram Message response time of more than 12 hours is unacceptable.
Use AI bots or virtual agents to handle common questions, freeing human agents to focus on more complex issues. For example, Nextiva’s intelligent virtual agents can answer FAQs, share self-service solutions, and route calls to the right agent if human assistance is required.
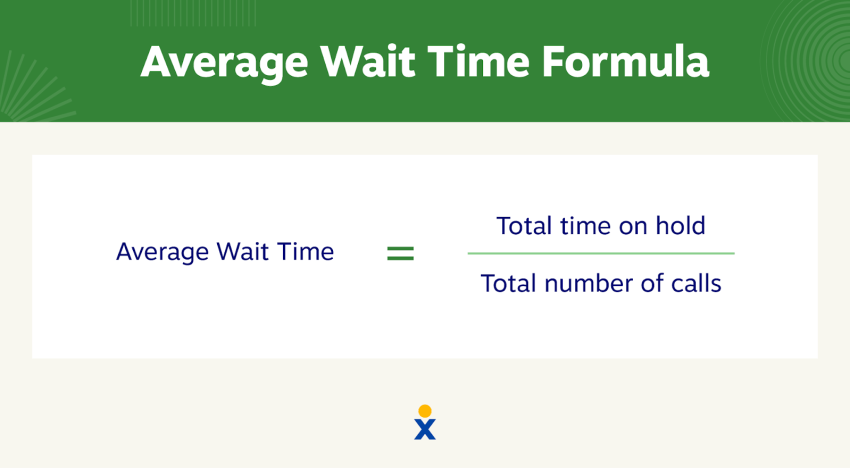
10. Average Wait Time (AWT)
Average wait time is the average time customers spend before connecting with a customer service agent.No one likes waiting on hold, especially your customers who have important questions about your products.
When customers wait, they’re 16 times more likely to feel impatient than excited or any other non-negative emotion besides neutrality.
Use a business VoIP phone service to gather and display vital customer information before answering their call, so your agents spend less time digging.
11. Average Handle Time (AHT)
Average handle time measures call center efficiency via the average amount of time a customer spends on a call from start to finish.
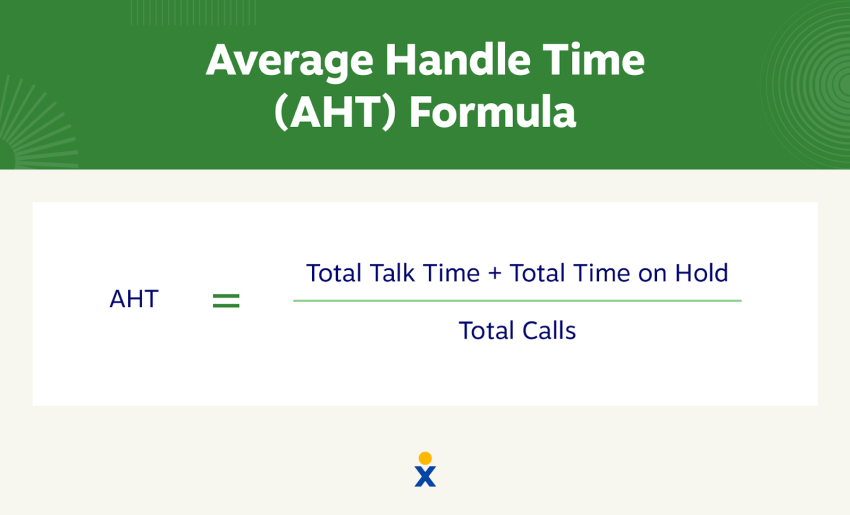
You can also use AHT to evaluate individual agent and team performance. Longer AHT for an individual might spotlight a coaching opportunity, while lower AHT across a customer service team may indicate a training need.
Introduce automations to tackle demanding agent tasks, including following up on customer queries.
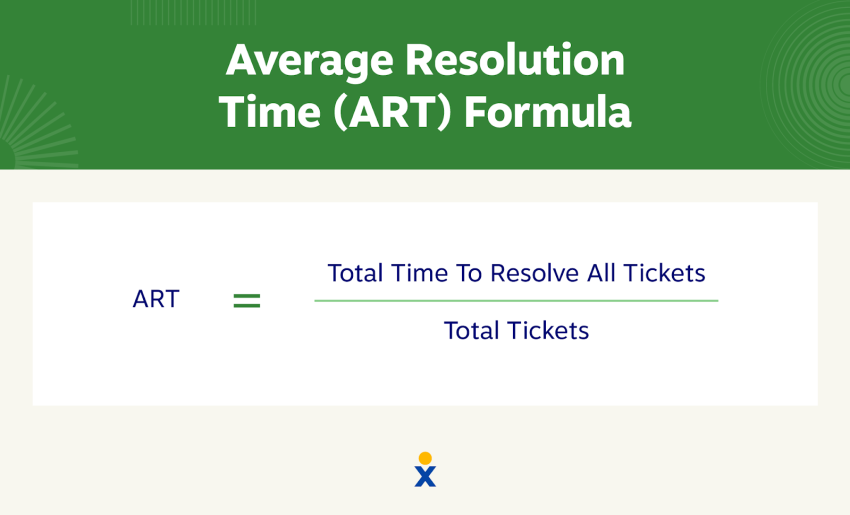
12. Average Resolution Time (ART)
Also called time to resolution, average resolution time is the time it takes to resolve a customer request from first contact.
The difference between ART and average handling time is that ART has a confirmed resolution, while AHT typically measures call length, regardless of the result.
With customer experience metrics like first response time and average interactions per ticket, ART can show how quickly your agents solve problems. If ART is high, your product needs more post-sale support, lowering your customer lifetime value as you spend more time dealing with issues.
Use unified communication tools that allow customers to continue conversations across channels. This limits repetition, speeds up problem-solving, and improves this important customer satisfaction metric.
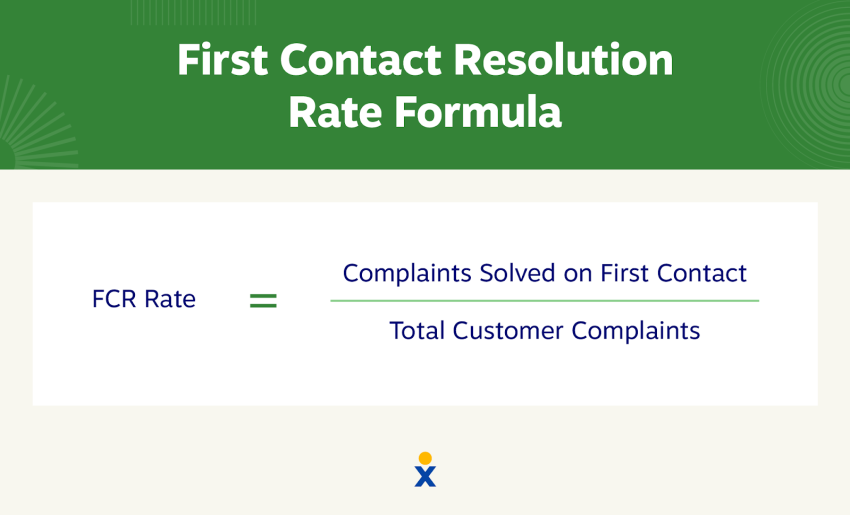
13. First Contact Resolution (FCR) rate
Also known as first call resolution, the FCR rate measures the percentage of customers who have their problem solved on the first call.
FCR can be tricky to measure without a proper CRM system. If you only measure phone numbers, you could dilute your data with calls from the same customer about different issues. If they call from two different phones or reach out through another channel, you’ll record two different customers.
According to our State of Customer Experience Report, 24% of respondents said their company doesn’t track the first contact resolution rate, which creates a blind spot in the customer experience.
FCR is also a key metric in call centers that captures a more nuanced customer annoyance: disappointment. They’ll start getting impatient if they never reach an agent. However, they may also become disappointed and annoyed if they get through to a customer service agent and don’t solve their problem.
Use intelligent call routing to connect customers with the most qualified agents based on business hours, issue type, customer value, or complexity. This reduces transfers and ensures faster, more accurate resolutions on the first contact.
14. Agent touches
Like the name suggests, agent touches is a metric that measures the number of times an agent responds to a ticket before it’s finally resolved. This is also called Replies per Resolution or Replies per Ticket.
Like average handle time, this metric also measures how much time an agent spends on a single support interaction. It also tells you about the effort a customer might have put in to get a resolution.
Not all extra touches are bad. A few additional replies to build rapport can lead to higher customer satisfaction scores. If an agent has too many replies per ticket consistently, you can check their CSAT scores to quickly gauge customer satisfaction from these long interactions.
Set up internal collaboration tools so agents can quickly consult product experts or managers without transferring the customer. Another tip is to keep the original agent involved during escalations instead of handing the case off entirely.

Customer Service Productivity & Performance Metrics
And, finally, these top customer service metrics are for productivity and performance.
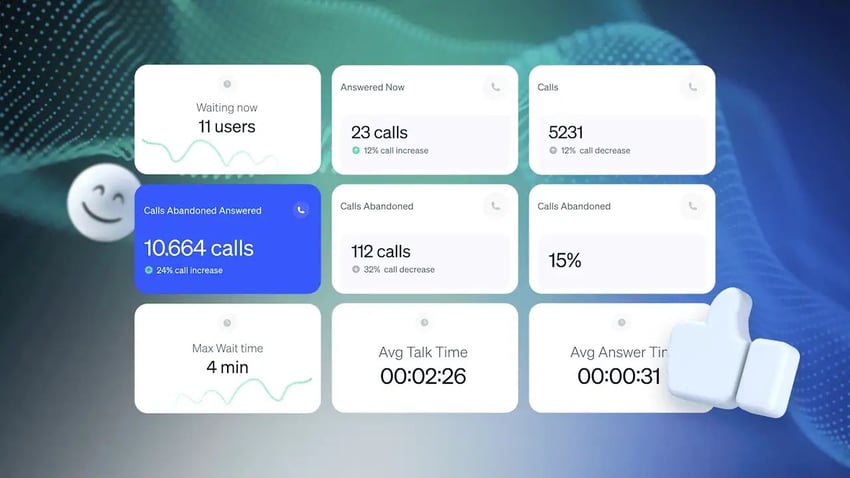
15. Rate of answered calls
The one frustration that enrages customers most is waiting through long, scripted prompts before speaking with an agent. A high percentage of missed calls means you have lots of customers with negative experiences who gave up before they got through to someone.
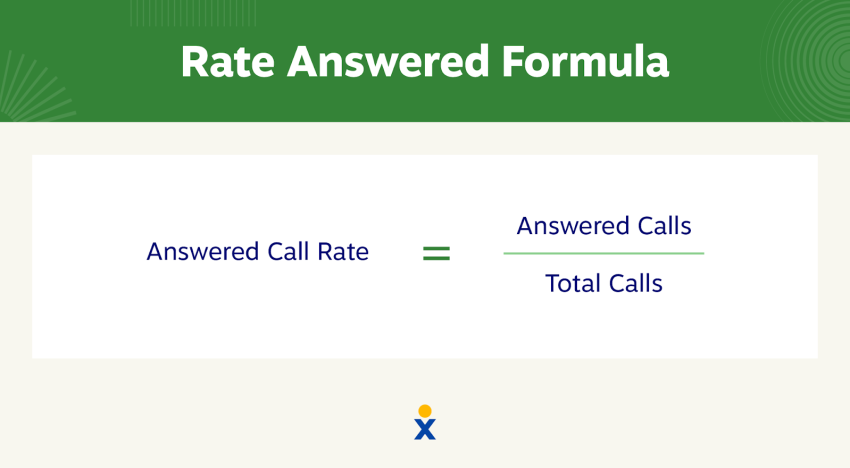
Measure your answered call rate to watch out for any spikes in customer dissatisfaction. If you use landlines, tracking customer service performance metrics can be difficult. But by integrating VoIP with a CRM, call tracking happens automatically.
Check out this breakdown of the rate of answered and missed calls.
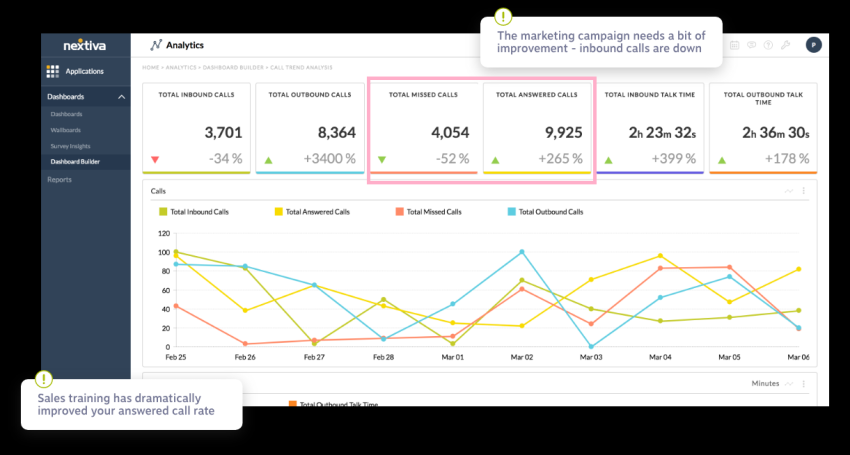
Use self-service resources like FAQs to help you triage high call volumes and reduce less urgent customer calls. Remember, a satisfied customer is one whose call is quickly answered.
16. Issue resolution rate
Your issue resolution rate is the percentage of total issues that your customer service team resolves. A happy customer is also one whose issue is resolved quickly, so a high resolution rate is always a priority for your customer support team.
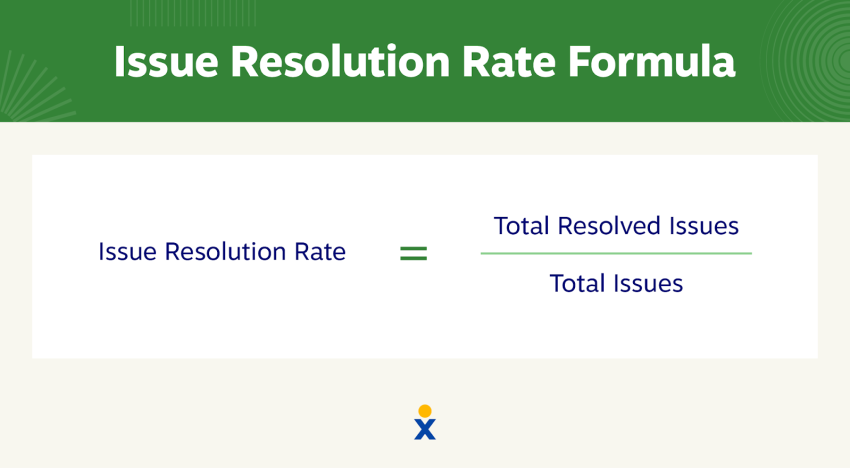
As IRR is a broader metric, you can increase it by working on other key metrics. For example, First Contact Resolution (FCR) directly boosts IRR, since issues resolved on the first attempt count toward it. So do high CSAT scores, as customers typically only give top ratings if their issue is resolved.
Create standardized resolution playbooks for common yet complex issues so agents can resolve problems quickly instead of reinventing solutions each time.
17. Ticket reopens
The ticket reopens metric measures how often an agent reopens a previously closed support ticket.
This customer support metric gives valuable insights into the complexity of customer issues and how effective your customer service processes are in resolving them on the first try. Tracking ticket reopen rates allows you to gauge how often customers need further assistance after their issue is thought to be resolved.
A high number of reopens may indicate unresolved issues or insufficient problem-solving in initial interactions. Ticket reopens can also highlight agent training gaps that lead to repeat customer dissatisfaction.
Provide adequate training to help agents handle complex issues. AI-powered call centers can provide real-time agent assistance and offer suggestions to help them resolve customer issues.

18. Self-service usage and success rate
Self-service usage measures the percentage of customers who resolve their issues using automated resources instead of contacting support directly.
This metric matters because it reduces agent workload and gives customers faster resolutions. A win-win, as most people prefer solving simple problems by themselves rather than waiting for support.
Key indicators of self-service success include:
- Traffic and customer engagement on knowledge bases and help centers
- Cases that open and close without agent involvement
- Positive feedback on support articles, such as ratings or upvotes
- Customers completing requests through interactive voice response (IVR) systems
Analyze which issues generate the most tickets and create clear, step-by-step guides for those problems.
Another tip is making your knowledge base easy to search by adding universal or AI-powered search features that provide quick answers along with links to relevant documents, so customers don’t have to dig through your resources.

Get Better Customer Service Insights with Nextiva
The metrics in this guide only tell the full story when tracked consistently across all customer touchpoints. And unified communication tools like Nextiva help you measure every step of the customer journey across multiple channels, so you get a full picture of your customer service ops.
This visibility helps spot patterns, like which channels resolve issues fastest or which customer groups need extra attention.
Now that you know what metrics to measure, the next step is setting up a system to help you measure and act on customer service data. This is where unified CX solutions like Nextiva really shine.
When you notice a trend, like declining first-contact resolution rates, you can quickly drill down to identify which agents or channels need support and then give them targeted coaching — putting your insights into action as soon as you discover them. The result: exceptional customer service that gets better by the day.
Your Call Center Solution
Take more customer calls with fewer agents. Built for any business at any stage. Including yours.
Customer Service Metrics FAQs
Get the details on customer support metrics with these frequently asked questions.
The best customer service KPIs (key performance indicators) measure the entire customer experience and map the journey from beginning to end. These include customer satisfaction score, average wait time, first contact resolution, average resolution time, and more.
Service-level metrics are internal metrics companies use to benchmark their customer service goals. These metrics aren’t made publicly available. They are often called SLAs and measure how many customer inquiries happen within a given time frame.
One of the best ways B2B companies can measure customer service ROI is with artificial intelligence (AI) tools. Conversational AI and other customer support tools allow you to analyze interactions and gain key insights like issue resolution rate, purchase frequency, and more.
Net Promoter, Net Promoter Score, and NPS are trademarks of NICE Satmetrix, Inc., Bain & Company, Inc., and Fred Reichheld.